Aotearoa New Zealand’s gross emissions continued to decrease in 2021, according to the national Greenhouse Gas Inventory.
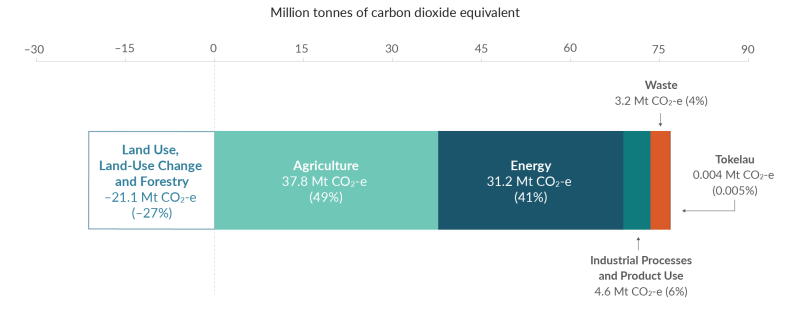
Gross emissions in 2021 were 76.8 million tonnes of carbon dioxide equivalent (Mt CO2-e) in 2021, a 0.7% reduction from 2020. This is the second successive year we have seen a slight decrease in gross emissions, after a 3% reduction in 2020, compared to 2019.
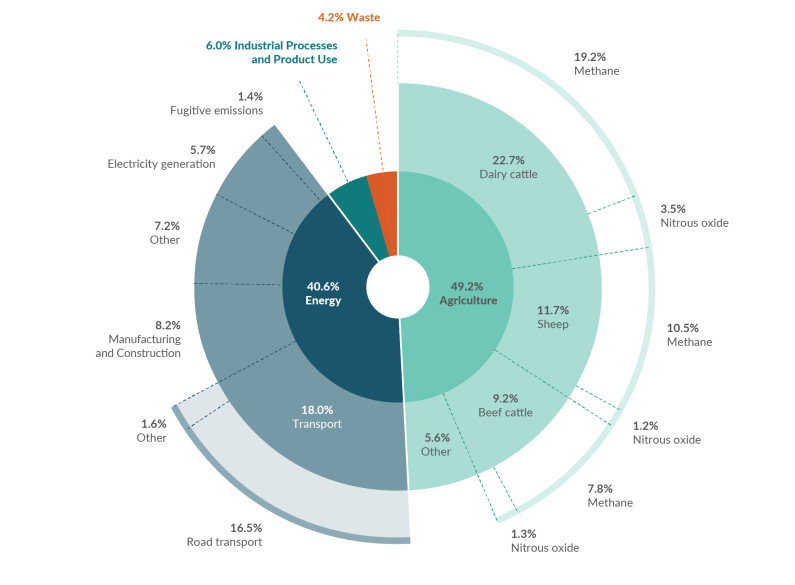
A large driver behind the gross emissions reduction in 2021 was a decrease in emissions from the agriculture sector. Agricultural emissions decreased by 1.5%, largely due to a reduction in dairy cattle and sheep numbers, and a fall in synthetic nitrogen fertiliser use.
Emissions in the waste sector reduced by 1.6% in 2021 compared to 2020, but as this sector is a smaller contributor to our gross emissions, it had a smaller overall impact.
COVID-19 continued to have some impact on emissions in 2021 but was not the biggest driver of reductions. Energy emissions, which include transport, increased by 0.3% compared to 2020, but remained below pre-pandemic levels.
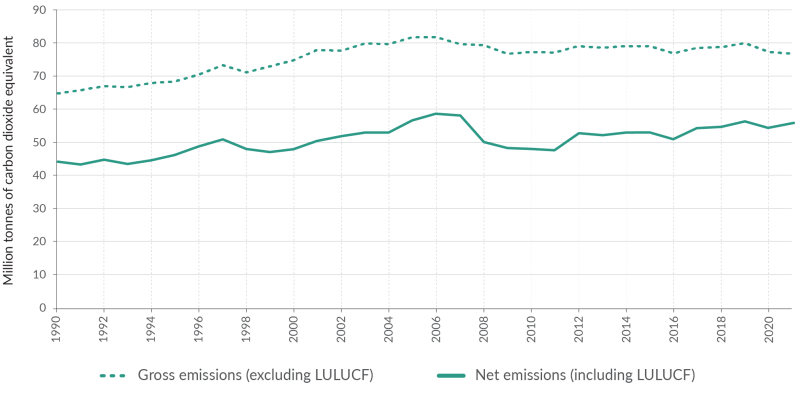
Net emissions, which include removals from land use and forestry, were 55.7 Mt CO2-e in 2021, an increase of 3% on 2020.
Net emissions are heavily influenced by planting and harvesting cycles. We are currently experiencing historically high harvest rates in our plantation forests, and because of this, we have a higher proportion of younger forests which grow more slowly and sequester less carbon than older ones. In addition, in 2021, harvesting returned to pre-pandemic levels.
The Greenhouse Gas Inventory is our annual report of all human-induced emissions and removals of greenhouse gases in New Zealand. It is submitted to the United Nations Framework Convention on Climate Change (UNFCCC) and provides the data we need to inform and support our climate policies.
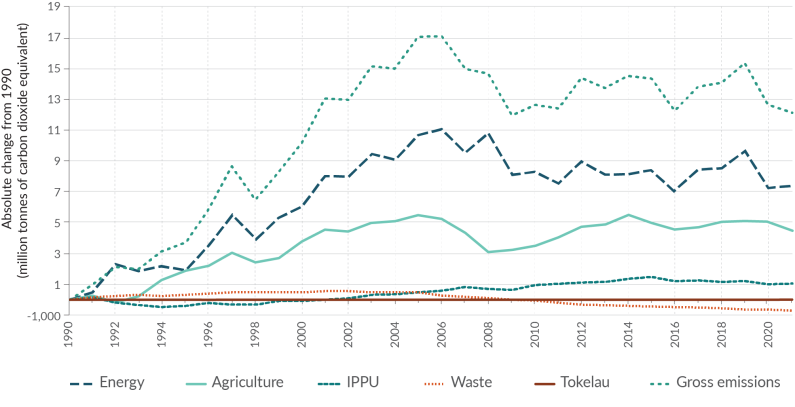
Since 1990, the UNFCCC’s base year, New Zealand’s gross emissions have increased by 19% and net emissions by 25%. Only the waste sector’s emissions have decreased (by 18%) since 1990, as we have got better at managing solid waste at municipal landfills.
Our first emissions reduction plan sets out how we will reduce greenhouse gas emissions across every sector from 2022 onwards and puts us on a path towards meeting Aotearoa New Zealand’s first emissions budget (2022-2025) and our long-term emissions reduction targets.