Our sustainability
Find out about the Ministry’s 2022-2025 sustainability strategy, performance against our emissions reduction targets, and climate-related disclosure.
Find out about the Ministry’s 2022-2025 sustainability strategy, performance against our emissions reduction targets, and climate-related disclosure.
Read our 2022-2025 sustainability strategy [PDF, 233 KB]
Our 2022-2025 sustainability strategy contains the Ministry’s shorter-term targets and longer-term goals which are focused on all aspects of our organisational sustainability.
We aspire to lead the public service in operating sustainably and reducing emissions. Our sustainability strategy is a core strategic document which holds us accountable and ensures we lead by example.
For us, sustainability as an organisation means:
We have a holistic view of sustainability, which is why our strategy includes three pillars:
We have had a sustainability strategy since 2018/19. Our emissions reduction targets are embedded within our strategy.
An internal work programme ensures we are meeting our targets.
In December 2020, the Government announced a climate emergency and launched the Carbon Neutral Government Programme (CNGP). Our successive sustainability strategies ensure we are meeting all commitments as outlined by the CNGP.
We achieved many successes over the 2022/23 financial year.
Highlights include:
We have set our emissions reduction targets in line with a global emissions pathway aimed at limiting warming to no more than 1.5 degrees Celsius.
These targets meet the expectations of the CNGP.
Bar graph showing the trajectory of the Ministry’s emissions. The X-axis shows the years 2018 to 2030. The Y-axis shows the levels of total gross emissions data in tonnes of carbon equivalent from 0 to 1,400 tCO2e.
There are data bars from 2018 to 2023 showing actuals emission data. The highest emissions are in 2018 with 1,324 tCO2e. Emissions in 2019 were 1287 tCO2e, and in 2020 were 660 tCO2e. The lowest emissions were in 2021 with 367 tCO2e. In 2022 emissions are 443 tCO2e and the latest emissions for 2023 are 758.38 tCO2e.
There are two trajectory lines showing both the reduction target and projected emissions for the entire time-period. The trajectory lines both slope downward with the highest point for both at 2018 levels and the lowest point at 662 tCO2e. The projected emissions graph takes a drastic drop in between 2018 and 2020, then continuing in an almost straight line to the end, while the reduction target gently slopes all the way.
There are three separate text boxes pointing out particular reduction targets of 26% for 2022, 35% for 2025 and 50% for 2030. These coincide with the dotted indicators showing the CNGP target years for reporting in 2025 and 2030.
We remain on track to meet our 2025 gross emissions reduction target, as shown in the graph above.
This is despite an increase in emissions, which is in part due to the absence of COVID-19 travel restrictions in the 2022/23 financial year. We have continued to use internal emissions budgets to manage our performance, encouraged online meetings and technology use, and implemented a new travel policy. Our new travel policy includes criteria that staff must meet to be allowed to book business class international travel, given it is both the higher emissions and cost option.
In 2022/23, we emitted 758.38 tCO2e, a 71 per cent increase on the previous year (442.97 tCO2e), and a 42.73 per cent reduction from our 2017/18 base year (1324.12 tCO2e). Our largest emissions sources are domestic air travel, international air travel (including business class, premium economy, and economy) and electricity use for our offices.
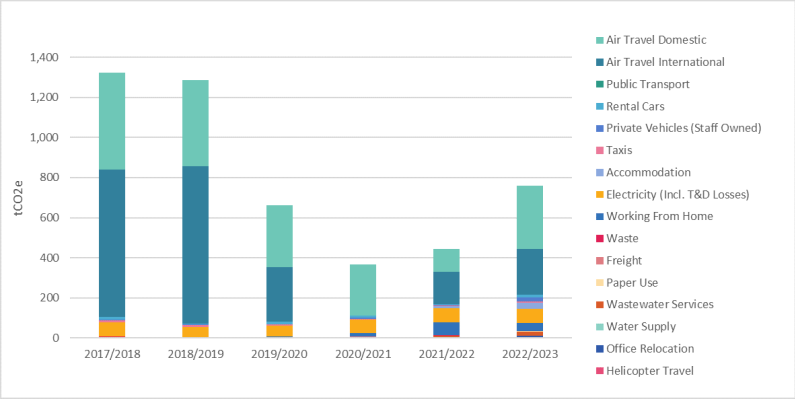
Graph description: Bar graph showing the Ministry’s total emissions divided into activity during a six-year period. The X-axis shows the financial years 2017/18 to 2022/23. The Y-axis shows the levels of total gross emissions data in tonnes of carbon equivalent from 0 to 1,400 tCO2e. The highest emissions are in 2017/18 with 1,324 tCO2e. Emissions in 2018/19 were 1287 tCO2e, and in 2019/20 were 660 tCO2e. The lowest emissions were in 2020/21 with 367 tCO2e. In 2021/22 emissions were 443 tCO2e. Our latest emissions are 758.58 tCO2e.
The emissions activities are divided into sixteen categories:
Breaking down our emissions profile by activity shows our biggest emissions sources. Air travel is consistently our largest source of emissions. We have seen a significant reduction in international travel emissions in comparison to our pre-COVID 19 years. One anomaly this year was helicopter travel supporting the Ministerial Inquiry into Land Use.
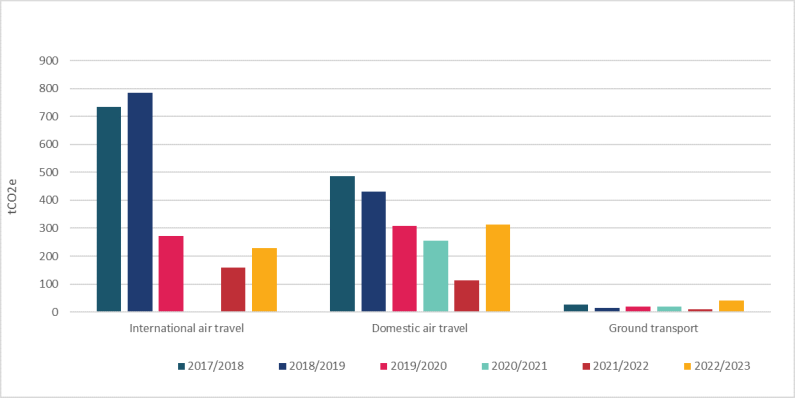
Graph description: Bar graph showing the Ministry’s total transport emissions divided into international air travel, domestic air travel and ground transport.
The X-axis shows the financial years 2017/18 to 2022/23.
The Y-axis shows the levels of total gross emissions data in tonnes of carbon equivalent from 0 to 900 tCO2e. International air travel has highs of 733 and 785 tCO2e in 2017/18 and 2018/19 respectively, with a sharp decline to 273 tCO2e in 2019/20. Then an anomaly year of 0 tCO2e in 2020/21. Emissions jumped slightly to 159 tCO2e in 2021/22 and the latest 2022/23 shows an increase across all data.
We continue to prioritise air travel for organisational emissions reductions, given it remains our largest source of emissions.
We have seen a rise in ground transport emissions on previous years. Emissions from taxis, rental and private car usage increased, and use of public transport remains low. In the 2023/24 financial year, we’ll review work programme demand and reasons for staff travel choices and look for improvements on existing support measures for low-emissions ground transport use.
We have made a conscious effort to reduce our travel emissions by implementing measures designed to support reductions including:
For more information on our sustainability performance read the sustainability sections of our annual reports:
* The Ministry reported 752.33tCO2e in its 2022/23 Annual Report, and incorrectly noted that taxi usage had reduced from FY2021/22. This was due to a process error in the Ministry’s third-party certification.
As part of our sustainability strategy and to meet the requirements of the Carbon Neutral Government Programme, we have committed to measuring, reducing and reporting on our organisational emissions profile and having them externally verified.
We have been measuring and reporting our emissions since 2018. We are proud to have achieved the Toitū carbonreduce certification for the sixth consecutive year.
View our emissions certification summaries on the Toitū website: