Our sustainability
Find out about the Ministry’s 2026-2028 sustainability strategy, performance against our emissions reduction targets, and climate-related disclosures.
Find out about the Ministry’s 2026-2028 sustainability strategy, performance against our emissions reduction targets, and climate-related disclosures.
Read our 2026-2028 sustainability strategy (PDF 376 KB)
Our 2026–2028 Sustainability Strategy sets out the Ministry’s shorter-term targets and longer-term goals for organisational sustainability.
The Strategy is responsive to change, and we will make interim updates when needed.
Sustainability at the Ministry means working within our budgets, reducing our environmental impact, and supporting our people. We focus on practical actions that support emissions reduction, responsible resource use, and organisational accountability.
We have set clear ambitions and measures in three areas:
You can find progress updates in our annual reports, under ‘Our Performance’.
Our targets align with the Carbon Neutral Government Programme (CNGP). They are grounded in international climate science and the goal of limiting global warming to 1.5°C.
We achieved our 2025 target on 30 June 2025.
Operational emissions are the emissions from running the Ministry’s own operations, including our offices and energy use, work travel and waste.
Each year we measure and independently verify our emissions, as required by the Carbon Neutral Government Programme (CNGP), and publish the results in our annual reports.
We achieved many successes over the 2024/25 financial year.
Highlights include:
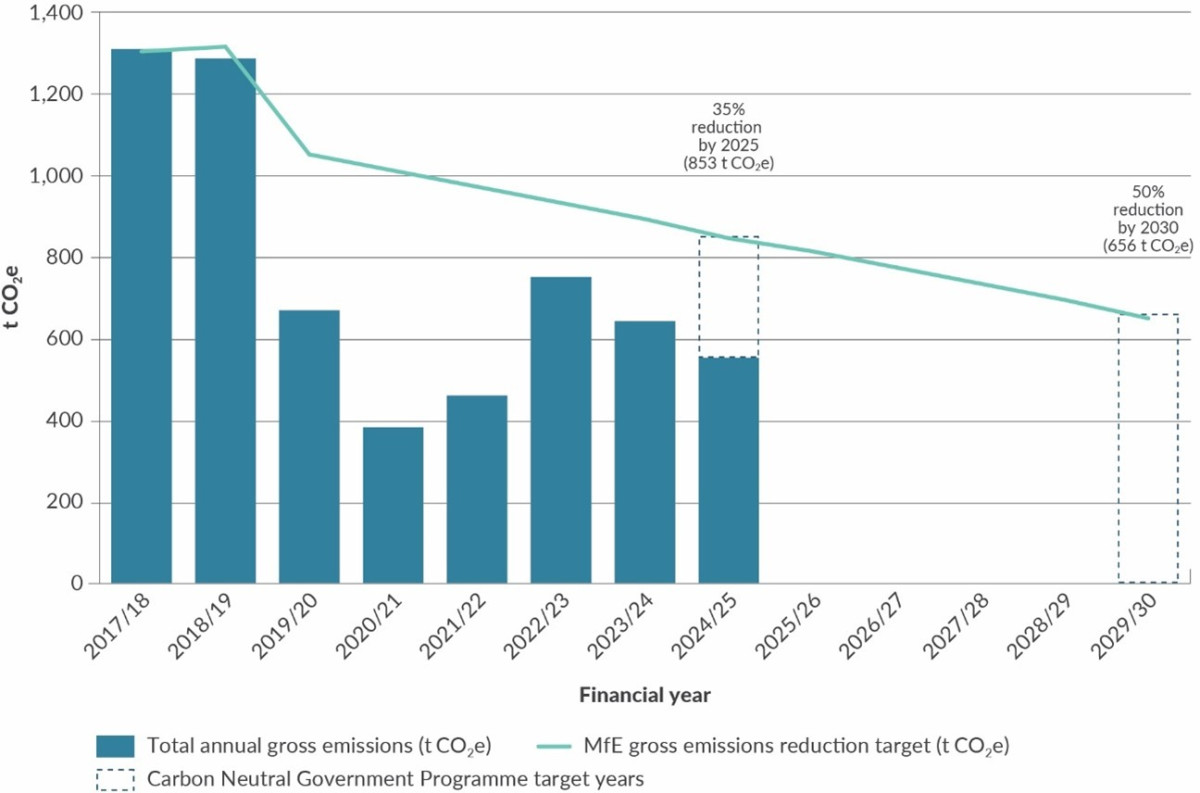
The Ministry for the Environment’s annual emissions reduction performance, 2017/18 to 2024/25

Bar chart of the Ministry’s gross emissions (tCO2e) from 2018 to 2025, with a projection to 2030. The x-axis shows years 2018 to 2030. The y-axis shows total gross emissions in tonnes of carbon dioxide equivalent (tCO2e) from 0 to 1,400. Actual emissions bars are shown for 2018 to 2025: 2018 is the highest at 1,312 tCO2e; 2019 is 1,289 tCO2e; 2020 drops to 670 tCO2e; 2021 is the lowest at 382 tCO2e; 2022 rises to 460 tCO2e; 2023 increases to 752 tCO2e; 2024 decreases to 643 tCO2e; and 2025 decreases further to 551 tCO2e. No bar values are shown for 2026–2029.
Targets are relative to the 2017/18 base year, shown as 2018 in this chart. The 35% reduction target for 2025 is marked at 853 tCO2e; actual emissions for 2024/25 are 551 tCO2e. This falls below the 2025 target reduction. A projection line shows the trajectory toward the 2030 target. This is a 50% reduction target and is 656 tCO2e.
We achieved our 2025 emissions reduction target on 30 June 2025 and remain on track to meet our 2030 gross emissions reduction target.
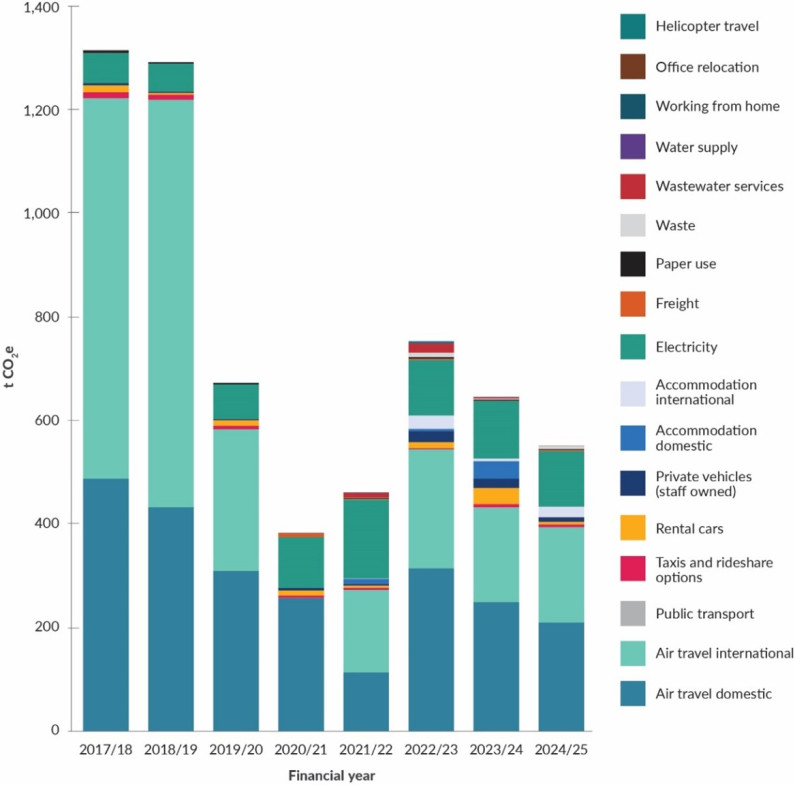
Stacked bar chart of the Ministry’s total emissions by activity (tCO2e) from 2017/18 to 2024/25. Each bar shows the total emissions for a financial year, split into activity categories such as domestic and international air travel, accommodation, road transport, electricity, freight, waste, and other sources.
Total emissions by year (tCO2e): 2018/19: 1,289; 2019/20: 670; 2020/21: 382; 2021/22: 460; 2022/23: 752; 2023/24: 643; 2024/25: 551.
Air travel makes up the largest share across the period. Total emissions drop sharply in 2020/21, rise in 2022/23, then decline through 2024/25. The fluctuations are driven by changes in annual air travel particularly over the Covid-19 period across 2020-2021.
Travel was our largest source of emissions in 2024/25 and made up about 90 percent of our total emissions. Domestic air travel was the biggest contributor, followed by international air travel.
International travel emissions were lower than in our 2017/18 base year. They vary year to year depending on business needs, including attendance at international events to represent national interests.
Emissions from electricity used for remote working increased compared with last year. We include remote working electricity use to better reflect our overall emissions profile. The increase was linked to fewer office spaces and changes in how we work.
We used less electricity overall, but the emissions impact was higher because the national electricity emissions factor increased. Our total electricity use in kilowatt-hours continues to reduce.
Waste to landfill is a priority area. We will focus on waste minimisation interventions and have strengthened our ambition in our sustainability strategy.

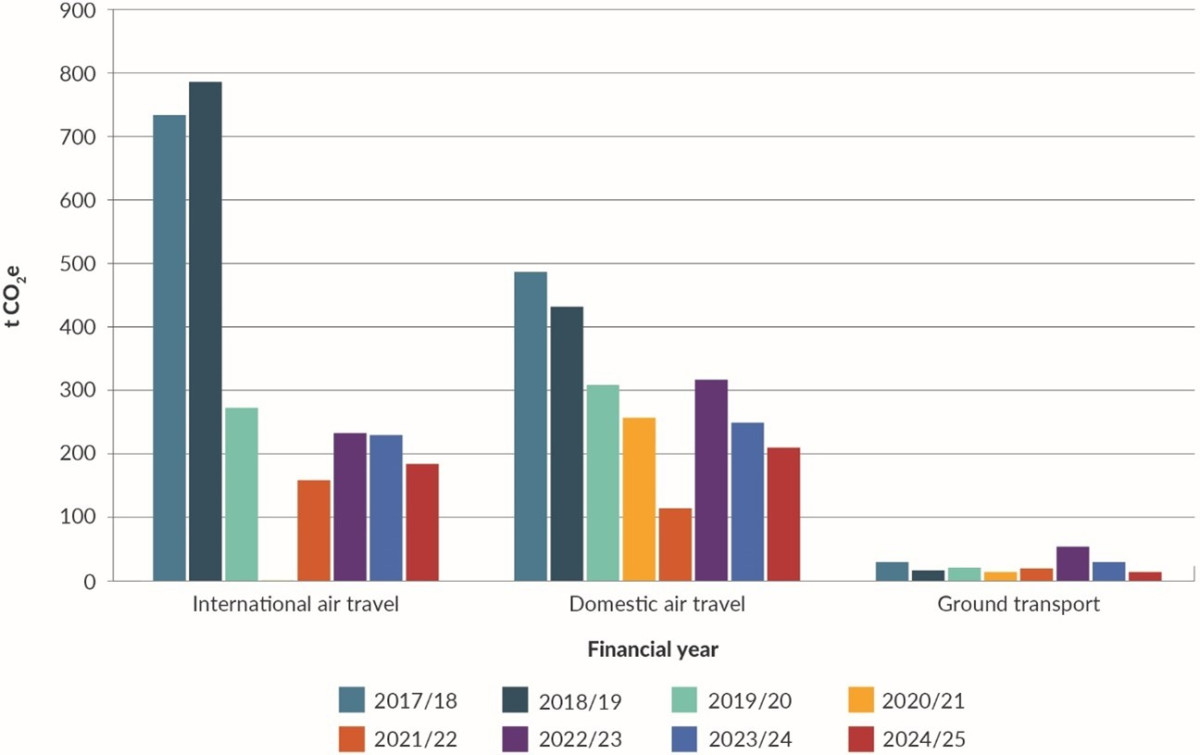
Bar graph showing transport emissions split into international air travel, domestic air travel and ground transport from 2017/18 to 2024/25. The X-axis shows the financial years 2017/18 to 2024/25 across internation and domestic air travel and ground travel (taxis, buses, rideshares, milage). The Y-axis shows the levels of total gross emissions data in tonnes of carbon equivalent from 0 to 900 tCO2e. Travel has declined across all modes of transport in 2024/25. Travel in 2020/21 and 2021/22 remains the lowest recorded due to the Covid-19 pandemic.
Bar graph showing transport emissions split into international air travel, domestic air travel and ground transport from 2017/18 to 2024/25. The X-axis shows the financial years 2017/18 to 2024/25 across internation and domestic air travel and ground travel (taxis, buses, rideshares, milage). The Y-axis shows the levels of total gross emissions data in tonnes of carbon equivalent from 0 to 900 tCO2e. Travel has declined across all modes of transport in 2024/25. Travel in 2020/21 and 2021/22 remains the lowest recorded due to the Covid-19 pandemic.
We prioritise air travel for organisational emissions reductions, because it remains our largest source of emissions. Since 2017/18 we have reduced air travel emissions substantially. This has reduced emissions and costs.
Domestic travel is influenced by our flexible-by-default workforce model. Staff work from locations across New Zealand. This increases the need for regional travel by air and ground. Our travel policy and emissions budgets guide when travel is necessary. We monitor travel demand and choices to meet business needs while reducing emissions.
We also invest and promote virtual collaboration tools to reduce travel where possible.
We have made a conscious effort to reduce our travel emissions. To support further reductions, we have:
For information about our sustainability performance, see the sustainability sections of our annual reports:
*Disclosure: In 2025, emissions data for 2017 to 2022 were restated after audit revisions, with guidance from Toitū. The updated figures replace those in the 2023/24 annual report and are final.
As part of our sustainability strategy and to meet Carbon Neutral Government Programme requirements, we measure, reduce and report on our organisational emissions, and have them independently verified.
We have measured and reported our emissions since 2018 and have maintained Toitū carbonreduce certification for eight consecutive years.
View our emissions certification summaries: